 ID
ID IT
IT DE
DE ZH
ZH ES
ES FR
FR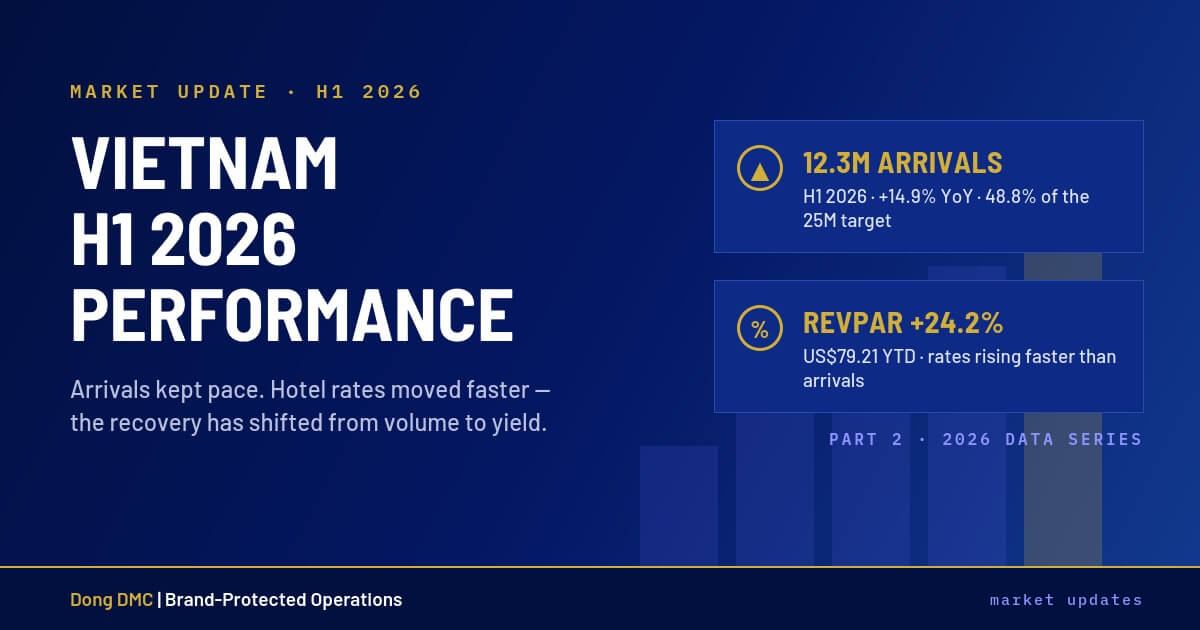
Vietnam H1 2026: Arrivals, Rates & 2027 Contracting
Market Update · Part 2 of the 2026 Data Series Vietnam received 12.3 million international arrivals in the first half of 2026, up 14.9% year-on-year — 48.8% of the government's 25-million full-year target (National Statistics Office / VNAT, July 2026). Hotel performance grew faster than arrivals: revenue per available room (RevPAR) reached US$79.21 year-to-date, up 24.2%, with room-night demand growing five times faster than new supply (CoStar, July 2026). For travel planners, the recovery has moved from volume to yield — and rate pressure is now segment-specific, which changes how 2027 group contracts should be structured. In Part 1 of this series we closed the books on a record 2025 and asked whether H1 2026 would clear 12 million arrivals. It did — and the more consequential story is what happened to hotel rates underneath. Every figure below is sourced and dated. Yes. Vietnam welcomed 12.3 million international arrivals January–June 2026 (+14.9% YoY) — the highest first-half total on record and nearly half the 25-million annual target. June alone brought 1.68 million arrivals (+14.7%) despite falling in the traditional low season. Domestic travel held equally firm: roughly 81 million trips, 54% of the annual target, with total tourism revenue near US$22 billion — just over half the full-year plan. Growth is broadening by region. Europe was the fastest-growing source region at +56.1% (~2 million arrivals), led by Russia's near-tripling; the US rose 18%, Canada 27.6%, and Australia over 22%. China remained the largest single market at 2.69 million, with South Korea second at 2.1 million. Air carried 82.6% of arrivals (10.1 million), while land arrivals jumped 37.5% on cross-border regional traffic. Because demand is outrunning supply. CoStar's national data shows room-night demand up 14.1% year-to-date against just 2.8% growth in available rooms — arrivals are converting into paid stays rather than stopping at the border-crossing statistic. The 14.1% demand growth tracks the 14.9% arrivals growth almost exactly, which is the strongest evidence yet that this cycle is real occupancy, not headline volume. The result is pricing power: occupancy, average daily rate, and RevPAR are rising together — occupancy at 63.9% YTD (from 58.4% across 2025), ADR at US$124.02 (+11.9%), RevPAR at US$79.21 (+24.2%). This is a different market from the 2022–24 recovery, when volume returned but hotels still discounted to fill rooms. The recovery is bifurcated by tier, not uniform: For group planners the middle row matters most: the tier where most series and incentive programs book is posting the strongest revenue growth in the market — which is exactly where incentive program cost structures will feel 2027 rate resets first. Vietnam has 38,354 rooms under construction against roughly 196,000 in CoStar's tracked national sample — and the pipeline is unevenly placed. Central & North holds 27,028 of those rooms; the South just 11,326. Yet the South currently outperforms: 64.4% occupancy and US$79.86 RevPAR against 58.8% and US$65.29 in Central & North, on the strength of HCMC's corporate, commercial, and MICE demand. New supply is therefore arriving where utilization is already lower. If international demand keeps compounding, the pipeline absorbs; if growth moderates, coastal nodes with heavy construction — Da Nang, Nha Trang, Phu Quoc, Ha Long — face localized oversupply and softer rates in the 2027–28 window. Most of the pipeline sits in the premium tiers (15,586 Luxury & Upper Upscale rooms; 20,420 Upscale & Upper Midscale), which is where that softening would land. Rate pressure is now segment-specific and region-specific, so one contracting posture no longer fits the whole portfolio. Three actions follow from the H1 data: Latest in the data seriesVietnam Market Update: Phu Quoc Rooms to April 2027 — nine-month arrivals and Phu Quoc room availability, October 2026. Contracting Vietnam programs for 2027? Our operations desk prices against live segment and regional conditions — including validity windows and escalation terms that reflect this market. Or quote it directly in the Agent App. US and Canadian agencies can reach our dedicated desk via the North America partner page. Discussing this brief on LinkedIn: agents and planners are sharing their read on the H1 numbers. Join the discussion → Dong DMC · Dong Thi Co., Ltd · International Tour Operator Licence 79-168/TCDL-GPLHQT · dongdmc.com · Figures are H1 2026 / year-to-date unless stated.Did H1 2026 arrivals keep pace with the record 2025?
H1 2026 at a glance
Metric
H1 2026 figure
Change
Source
International arrivals
12.3M (48.8% of target)
+14.9% YoY
NSO / VNAT, Jul 2026
Arrivals by air
10.1M (82.6%)
+11.4%
NSO, Jul 2026
Domestic trips
~81M (54% of target)
—
VNAT, Jul 2026
Tourism revenue
~US$22B (50.5% of plan)
—
VNAT, Jul 2026
Hotel occupancy (YTD)
63.9%
vs 58.4% FY2025
CoStar, Jul 2026
ADR (YTD)
US$124.02
+11.9%
CoStar, Jul 2026
RevPAR (YTD)
US$79.21
+24.2%
CoStar, Jul 2026
Why is hotel revenue growing faster than arrivals?
When occupancy and rate rise at the same time, hotels stop negotiating on price and start negotiating on terms. That shift reaches B2B net rates before it reaches published rates.
Which hotel segments are leading — and which are struggling?
Where is new hotel supply concentrated?
What does this mean for 2027 group contracting?
Sources